It's been a long time since I posted something new, useful and innovative in my 108obiee.blogspot.com blog as I have less time for this because my current job now is mostly OFSAA based, but I'm trying to be up to date with all other.
There is one interesting technical book on the market, about which I would now like to say something, not in detail, but describe all chapter in few words. The name of the book is The Business Analyst's Guide to Oracle Hyperion Interactive Reporting 11 (by author Edward J. Cody). This book has been published by Packt Publishing (http://www.packtpub.com). Thanks them for sending me a copy to review it.
The book is intended to primarly Oracle Hyperion Interactive Reporting user, but also may be used from inexperienced users to the business analyst, or we can apply i as the basics for all Oracle Hyperion Interactive Reporting developers. The book is written using EPM 11.1.1.3. Examples are based on Sales and Cost model.
Although we often use this or similar software like this in combination to queries against multidimensional data, examples in this book are focused on relational data source queries.
This book concentrate on usage of Interactive Reporting Web Client software and starts with short introduce to the EPM Workspace. And for those who don't know Oracle Hyperion Interactive Reporting is very powerful analytical and business intelligence engine/tool for ad-hoc querying, data analysis, dashboards, and other reporting capabilities.
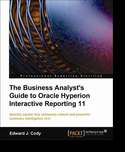
The book cover:

Now, on the first chapter - Chapter 1 - Oracle Hyperion Interactive Reporting you'll get an overwiev of Oracle Hyperion Interactive Reporting and EPM Workspace. First navigation to EPM Workspace, how to install and activate Web Client and understand Web Client interface and other useful information on manipulating documents and edit file properties and many more.
How to build efficient query in Interactive Reporting document (file), manage query and get data from the source (database) you'll learn in Chapter 2 - The Query. Also, this chapter covers requests (queries), filters, sorting, how to identify metadata and many more. All this is explained in detail in the appropriate order. It is very easy for someone without experience or for analysts to build a query and get a result data. I have noticed a great filer options, you can build very powerful filter.
Chapter 3 - The Data Model explains data model creation in detail (tables, joins and some advanced features) as pre-requisite for building queries. If you want to play with advanced querying, column expressions and functions, advanced filtering and joins and all that using custom SQL, combining data from separate queries in one query or using subquery - this is well explained in the Chapter 4- Advanced Querying and Filtering, which you should read more carefully and slowly.
The next chapter, Chapter 5 - Results and Tables is more complex and explains table and results sections, what is their mutual relationship and also their relationship with the query section. You'll understand possibilities of filters on these sections, how to do a sorting, create totals and computed items. I must admit that I had to read twice this chapter in order to understand all. It would be good for readers to have some pictures about the table section to completly understand the relation of table section in comparision to results and query section.
Chapter 6 - Pivots, explains how to analyze and present data using pivot sections, from the pivot creation till sorting, analyzing content and adding totals and computed items, using grouping column items, drill functionality and pivot formatting.
Next chapter, Chapter 7 - Charts, explains different chart formats and types and just like all chapter before describes in detail creating charts, adding content, how to analyze data with charts, sorting, grouping, drills and more. Lots of pictures in this chapter.
How to combine reporting objects (pivots, charts, etc) and data in unique view it is written in Chapter 8 - Reports. Understand report layout step by step, adding content, building report tables, using expressions, combining data from multiple datasets, slice data using some advanced features and other.
The last chapter, Chapter 9 - Dashboard, explains how to build an interactive dashboard and provide high level interface to the business analyst. Understand all dashboard elements, add controls (drop down prompt for example), using script editor to write custom code (Java Script I think) and more.
More about the book here https://www.packtpub.com/oracle-hyperion-interactive-reporting-11-1-business-analysts-guide/book.


