SH.SALES -> contains detail data about amount and quantity sold.
SH.QUANTITY_QUOTAS -> data about quantity quotas on category and month level:
create table quantity_quotas
as select sum(quantity_sold)+10 as quota, p.prod_category_id, t.calendar_month_id
from sales s, times t, products p
where s.time_id=t.time_id
and p.prod_id=s.prod_id
group by p.prod_category_id, t.calendar_month_id
HR.ANNUAL_SALES_PLANNED -> on year level.
create table annual_sales_planned as
select sum(amount_sold)*108 as annual_sales_planned, t.calendar_year_id
from sales s, times t
where s.time_id=t.time_id
group by t.calendar_year_id
Now we want to include all these threee tables (measures) in one logical fact table.
My connection pool is set to HR so I need to do:
create or replace public synonym quantity_quotas for sh.quantity_quotas
and
grant select on quantity_quotas to hr
We created manually separate higher level dimension tables that we used in QUANTITY_QUOTAS and ANNUAL_SALES_PLANNED fact tables:
CATEGORY -> select distinct PROD_CATEGORY_ID, PROD_CATEGORY from times
MONTHS -> select distinct CALENDAR_MONTH_ID, CALENDAR_MONTH_DESC, CALENDAR_YEAR_ID, CALENDAR_YEAR from times
YEARS -> select distinct CALENDAR_YEAR_ID, CALENDAR_YEAR from times
Physical diagram:

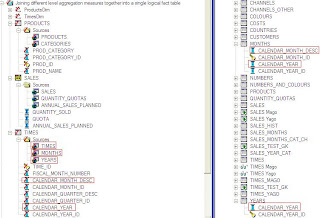
Drag and drop PROD_CATEGORY from CATEGORY table in physical layer to PROD_CATEGORY column in PRODUCTS logical table in BMM. New logical table source appears:

Note that there ae two sources for PROD_CATEGORY, this is required to generate separate SQL queries, one for SALES fact table and one for QUANTITY_QUOTAS table.

Repeat this step for TIMES logical table, drag and drop columns CALENDAR_MONTHS_DESC and CALENDAR_YEAR from MONTHS table and CALENDAR_YEAR from YEAR table in physical layer into same column names:

There are two sources for CALENDAR_MONTH_DESC and three sources for CALENDAR_YEAR:


Now drag and drop measures from fact tables from physical layer, drop it to on the top of the SALES logical table so that new logical table source and new measure appeared:

We don't need to setup for logical table sources QUANTITY_QUOTAS and ANNUAL_SALES_PLANNED aggregation content group by to be in certain logical dimension level:

This works without that. How we know this?
I introduce a similar model diagram in one of my previous post about time series modelling
http://108obiee.blogspot.com/2009/01/time-series-modelling.html.
I explained situation when OBIEE generates more than one queries, in this case three separate queries will be generated if we choose for example column CALENDAR_YEAR, because it has three dimension logical table sources and according to our physical model diagram each of them (MONTHS, YEARS and TIMES) is joined to a different measure in different fact tables (SALES, ANNUAL_SALES_PLANNED and QUANTITY_QUOTAS). So we see only three queries in NQQuery.log OBIEE join them with group by column that is common to all three queries.
Test:


We see that all three tables can summarize data on year level.
Now if we group by only by CALENDAR_MONTH_DESC:


Only first two queries are populated. The third one (ANNUAL_SALES_PLANNED fact table) is not because it contains data on year lever only, not lower. So null value is populated for ANNUAL_SALES_PLANNED measure.


1 comment:
Good post! Should answer about 5-10 questions on OTN every week.
Mind you, you'll still need to repost the link every single time since they still can't use the forum search or Google ;-)
Cheers,
Christi@n
Post a Comment