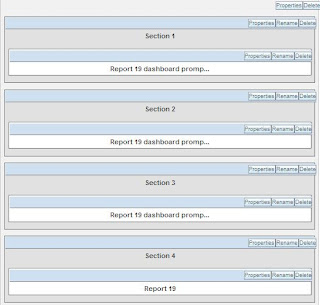
Three dashboard prompts. One is showing only days or months selection and after pressing GO button we are showing second section with day values in dashboard prompt or third section with month values in dashboard prompt. The second and third sections are guided navigated and we only show one section depends on what user selects from the first dashboard prompt (first section), days or months. After we select value from the second dashboard prompt we get our report. The report is only one, with dynamic column in the group by part, depends on what user selects. For this example I used guided navigation applied on sections. I'll explain it in detail.
The first dashboard prompt applied on the first section:

Show/SQL Results:
SELECT case when 1=2 then TIMES.CALENDAR_MONTH_DESC
else 'Day'
end FROM "Normal model"
union all
SELECT case when 1=2 then TIMES.CALENDAR_MONTH_DESC
else 'Month'
end FROM "Normal model"
First section:

Dashboard prompt applied on the second section:

Column formula for date from:
case when 1=2 then TIMES.TIME_ID else cast ('1.1.1900' as date) end
Column formula for date to:
case when 1=2 then TIMES.TIME_ID else cast ('1.1.1901' as date) end
Second section:

Guided navigation report applied on the second section:

Column formula for pv_dyn_group_by column (we can delete it after we make filter):
'@{pv_dyn_group_by}'
The report will show data if the presentation variable from the first section (first dashboard prompt) pv_dyn_group_by is filled with Day harcoded value. So the second section is whowed only in this condition. TIMES.CALENDAR_YEAR is dummy column.
Dashboard prompt applied on the third section:

Third section:

Guided navigation report applied on the third section:

Column formula for pv_dyn_group_by column (we can delete it after we make filter):
'@{pv_dyn_group_by}'
The report will show data if the presentation variable from the first section (first dashboard prompt) pv_dyn_group_by is filled with Month harcoded value. So the second section is whowed only in this condition. TIMES.CALENDAR_YEAR is dummy column.
Target report and the section four:

Column formula for dynamic group by column:

Must be same datatypes inside it.
Filter (advanced, convert this filter to SQL option):

Section four:

Guided navigation report applied on the section four:

We need this guided navigation report that we applied on the section four because at initial we don't want to show target report, we show it only when one of the value of the presentation variable pv_dyn_group_by is selected, and that is Day or Month value, from the first dashboard prompt from the first section.
Filter (advanced, convert this filter to SQL option):

We applied guided navigation reports in the properties of the section, we do the same for the second and the third section (explained before):

Finally, this is complete view, with all sections:

Now, we are going to test this solution.
Test
Initial:

Select Day and press the first GO button:

Dashboard prompt with dates is shown:

Choose date from and to values and press the second GO button:

Target report for this case:

Now, change the value to Month and press the first GO button again:

Dashboard prompt with months is shown:

Choose month from and to values and press the second GO button:

Target report for this case:


1 comment:
I chanced upon to view your blog and found it very interesting. Great ... Keep it up!
Post a Comment